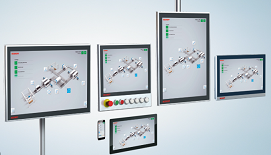
PLC HMI
| Feature | TF1800 PLC HMI | TF2000 TwinCAT HMI Server |
| HMI type | PLC visualization | Web-based HMI system |
| Engineering location | Inside the PLC project | Separate TwinCAT HMI project |
| Engineering tool | TwinCAT PLC visualization editor | TE2000 TwinCAT HMI Engineering |
| Runtime component | TF1800 PLC HMI client | TF2000 HMI Server |
| Typical display | Local panel/IPC application | Web browser or HMI client |
| PLC communication | Directly connected to PLC variables | HMI Server communicates through ADS |
| Other data sources | Limited compared with TF2000 | PLCs, multiple runtimes, OPC UA and server extensions |
| Multiple PLCs | Not its main purpose | Designed for multi-runtime and multi-server systems |
| Multiple clients | Possible using additional PLC HMI clients | Designed for browser-based multi-client operation |
| User management | Relatively basic | Advanced users, roles and permissions |
| Custom development | Limited PLC visualization functions | HTML5, CSS, JavaScript, TypeScript and server extensions |
| Data handling | Mainly live PLC visualization | Recipes, alarms, localization, data grids, databases and extensions |
| Complexity | Simpler | More powerful but more complex |
| Best suited for | Small machine or local control panel | Modern SCADA-like and distributed HMI applications |
Step by Step simple PLC HMI
The project contains: – One BOOL variable: bRun – One REAL variable:
fGaugeValue – One START/STOP button – One dial gauge (Meter) – A simple
PLC program that increases/decreases the gauge value
When START/STOP is ON, the gauge value increases toward 100. When
START/STOP is OFF, the gauge value decreases toward 0.
1. CREATE A NEW TWINCAT PROJECT
Open Visual Studio with TwinCAT XAE installed.
Select: File -> New -> Project
Select: TwinCAT Projects -> TwinCAT XAE Project
Name the project: SimplePlcHmi
The TwinCAT solution should contain items such as: SYSTEM MOTION PLC I/O
2. ADD A PLC PROJECT
Right-click: PLC
Select: Add New Item
Select: Standard PLC Project
Name it: PLC1
TwinCAT creates the PLC project with folders such as: PLC1 POUs MAIN
GVLs DUTs References VISUs
3. CREATE THE PLC VARIABLES
Open: PLC1 -> POUs -> MAIN
Add these variables:
PROGRAM MAIN
VAR bRun : BOOL := FALSE;
fGaugeValue : REAL := 0.0;
END_VAR
Then add the following PLC program:
IF bRun THEN fGaugeValue := fGaugeValue + 0.1;
    IF fGaugeValue >= 100.0 THEN
        fGaugeValue := 100.0;
    END_IF
ELSE
fGaugeValue := fGaugeValue - 0.1;
    IF fGaugeValue <= 0.0 THEN
        fGaugeValue := 0.0;
    END_IF
END_IF
If bRun = TRUE, fGaugeValue increases. If bRun = FALSE, fGaugeValue
decreases. The value is limited between 0.0 and 100.0.
4. BUILD THE PLC PROJECT
Select: Build -> Build Solution
or press: Ctrl + Shift + B
Check that there are no compilation errors.
5. ADD A VISUALIZATION
Find the VISUs folder in the PLC project.
Right-click: VISUs
Select: Add -> Visualization
Name the visualization: MainVisu
Open MainVisu
A blank visualization design screen should appear.
6. OPEN THE VISUALIZATION TOOLBOX
If the Toolbox is not visible, select: View -> Toolbox
The Toolbox contains visualization controls such as: Button Rectangle Text Ellipse Bar Meter etc.
7. ADD A BUTTON
Find Button in the Visualization Toolbox.
Drag the Button onto MainVisu.
Select the Button.
Open the Properties window if necessary: View -> Properties Window
8. SET THE BUTTON TEXT
Find the text property of the Button.
Set the text to: START / STOP
9. CONNECT THE BUTTON TO bRun
Select the Button.
Find its Input Configuration.
Configure the button to toggle a variable when clicked.
Select: Toggle variable
Assign: MAIN.bRun
The button now toggles bRun between TRUE and FALSE.
10. ADD THE DIAL GAUGE
Find: Meter
in the Visualization Toolbox.
Drag the Meter onto MainVisu and resize it so the gauge is clearly visible.
11. CONFIGURE THE METER RANGE
Select the Meter.
Configure approximately: Scale Start = 0 Scale End = 100
If angle settings are available: Start Angle = 180 degrees End Angle = 0 degrees
This produces a semicircular gauge.
12. CONNECT THE METER TO THE PLC VARIABLE
Select the Meter.
Find the property that defines the displayed value or variable.
Assign: MAIN.fGaugeValue
You can normally use the Input Assistant (…) to select the variable.
Navigate to: PLC1 MAIN fGaugeValue
The relationship is:
START/STOP Button | v MAIN.bRun | v PLC Program | v MAIN.fGaugeValue | v
Meter
13. ACTIVATE THE TWINCAT CONFIGURATION
Select: TwinCAT -> Activate Configuration
Allow TwinCAT to restart into Run Mode if requested.
Then: PLC -> Login PLC -> Start
14. TEST THE VISUALIZATION
Open: MainVisu
Test it using TwinCAT’s Integrated Visualization.
Click START / STOP.
bRun becomes TRUE and the PLC increases fGaugeValue. The Meter needle
should move toward 100.
Click START / STOP again.
bRun becomes FALSE and the Meter needle should move back toward 0.
15. ADD TF1800 PLC HMI TARGET VISUALIZATION
After the basic visualization works, find: Visualization Manager
Right-click: Visualization Manager
Select: Add -> TargetVisualization
TwinCAT adds TargetVisualization and creates VISU_TASK.
16. SELECT THE START VISUALIZATION
Open: TargetVisualization
Find: Start Visualization
Select: MainVisu
17. ACTIVATE THE CONFIGURATION AGAIN
Select: TwinCAT -> Activate Configuration
Then: PLC -> Login PLC -> Start
18. FINAL PROJECT STRUCTURE
PLC PROGRAM | +– bRun : BOOL | +– fGaugeValue : REAL | v PLC
VISUALIZATION | +– START/STOP Button | | | +—-> MAIN.bRun | +– Meter | +—-> MAIN.fGaugeValue
19. HOW THE PROGRAM WORKS
Initially: bRun = FALSE fGaugeValue = 0.0
When the START/STOP button is clicked: bRun = TRUE
The PLC increases fGaugeValue toward 100 and the Meter displays the
value.
When the button is clicked again: bRun = FALSE
The PLC decreases fGaugeValue toward 0.
20. PLC VISUALIZATION OPTIONS
PLC Program | v MainVisu | +—- Integrated Visualization | +—- TF1800 PLC
HMI | +—- TF1810 PLC HMI Web
Integrated Visualization: Used mainly during engineering/testing inside the TwinCAT development environment.
TF1800 PLC HMI: Uses TargetVisualization to display the PLC visualization as a PLC HMI.
TF1810 PLC HMI Web: Uses WebVisualization and allows the visualization to be displayed using a web browser.
21. NEXT STEP
Once this example is working, it can be extended with:
1. Numeric display for fGaugeValue
2. Numeric input
3. Green RUN indicator
4. Red STOP indicator
5. Additional buttons
6. Alarm indication
7. Multiple visualization pages
8. Page navigation
9. Real PLC analog input instead of the simulated value
10. TF1810 WebVisualization
A useful next exercise is to keep this exact PLC program and MainVisu and add TF1810 PLC HMI Web.
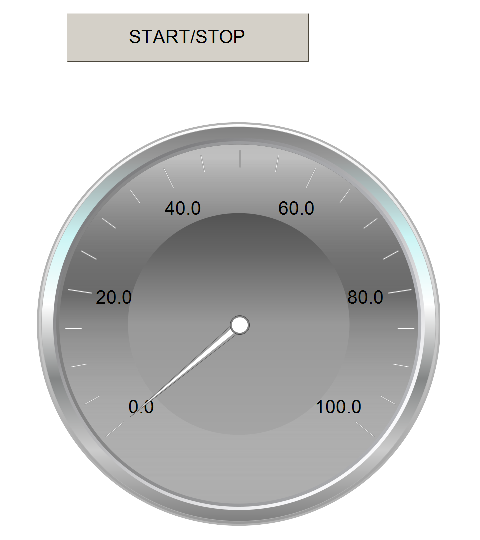
Figure 01: Sample HMI based on our tutorial
Download the Sample
The sample can be downloaded from the link below
What next
Download the sample from the link given above.
See next: What is a state machine in Structured Text: https://www.hemelix.com/plc/state-machine-in-structured-text/
Ask questions related to Hemelix sample code and design in the Google group https://groups.google.com/g/hemelix