
Historical data
Historical data:
Down the sample project (HistoricalData_Hemelix.zip)
A Data Historian is a type of time-series database designed to collect and store process data from an automated system efficiently. So data can be collected, stored, and processed to see how well the system is performing.
It allows operators and stakeholders to look at historical data for the plant. A Data Historian is a software program that records and retrieves production and process data over time. Some software systems clearly define event and data historians separately.
Data Historian – where you can store the value of data point tags historically.
Historical data are data from earlier times that are stored in a database.
Arbitrary server symbols of the TwinCAT HMI (e.g. numerical values from the PLC) can be historized by the TcHmiSqliteHistorize extension. The extension saves the data in a ring buffer in an SQlite database. The interval at which the data are saved in the database can be defined for each symbol. The data are saved in the database only as long as the server is running. No historical data are written to the database if the server is terminated.
The historical data are displayed in an included control – the Trend Line Chart. The control enables the display of various historical data at the same time.
Event Log – where an audit of events is stored.
Time series information is often displayed in a trend or as tabular data over a time range (ex. the last day, last 8 hours,
last year).
The historical data can then be used to display trends of process data on charts, create reports, or perform data analysis.
If we consider the historian as a whole software package then it can perform the following tasks:
=> Data collectors from the data sources such as a PLC, automation devices, OPC servers, etc.
=> The software processes the data and delivers the data to client applications.
=> The software provides data for client applications for data reporting, charting, and analysis.
Historical data are data from earlier times that are stored in a database.
Arbitrary server symbols of the TwinCAT HMI (e.g. numerical values from the PLC) can be historized by the TcHmiSqliteHistorize extension. The extension saves the data in a ring buffer in an SQlite database. The interval at which the data are saved in the database can be defined for each symbol. The data are saved in the database only as long as the server is running. No historical data are written to the database if the server is terminated.
The historical data are displayed in an included control – the Trend Line Chart. The control enables the display of various historical data at the same time.
The Trend Line Chart can show the data which we need to configure. We can follow the following steps (these steps are adjusted according to our fictitious home automation system yard gate control).
STEP 01:
We need to make sure we have the right historized extension installed in our TwinCAT system
=> Bring the HMI Engineering config page and check the version.
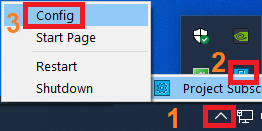
Figure 1: Steps for opening the HMI server config page
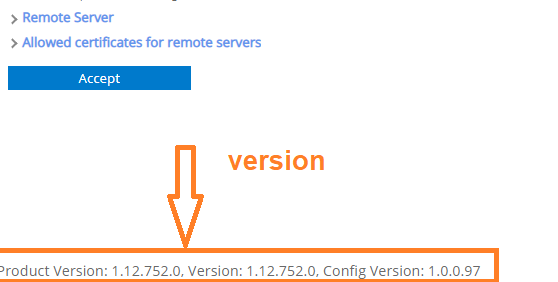
Figure 2: HMI product version
STEP 02:
Find the Nuget package (project | References | Nuget packages) and the same version as your SDK as shown in the following figure.
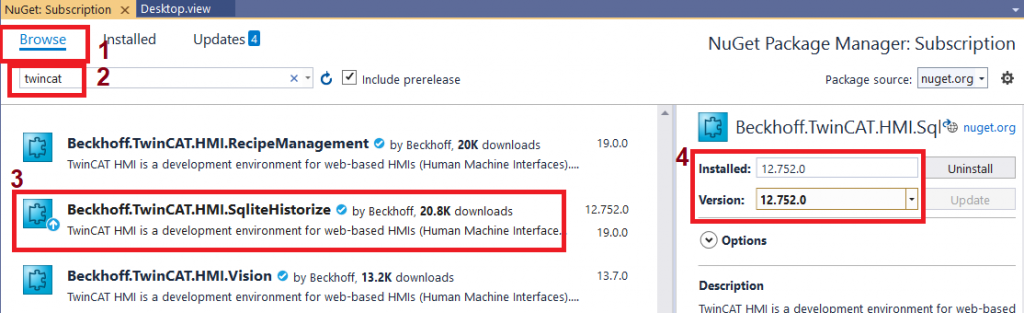
Figure 3: Installation of correct Nuget packages
STEP 03:
Install the package and activate it if needed.
STEP 04:
Historize the target symbols (Extension | TwinCAT HMI | Windows| HMI Configurations | Mapped Symbols), select the symbol and historize it.
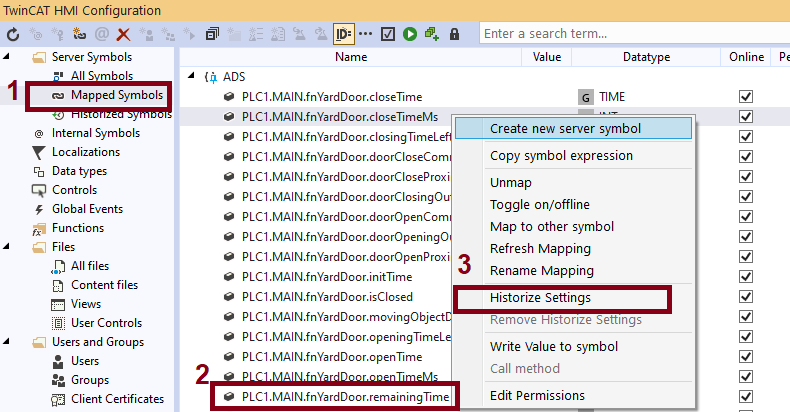
Figure 4: Process to tell the historized extension what symbol should be recorded
STEP 05:
Y-axis configuration, we can change the configuration as needed. Most default settings are fine, but we change the following parameters as needed by our project. Case 4 in the following figure has the min value and max value reconfigured.
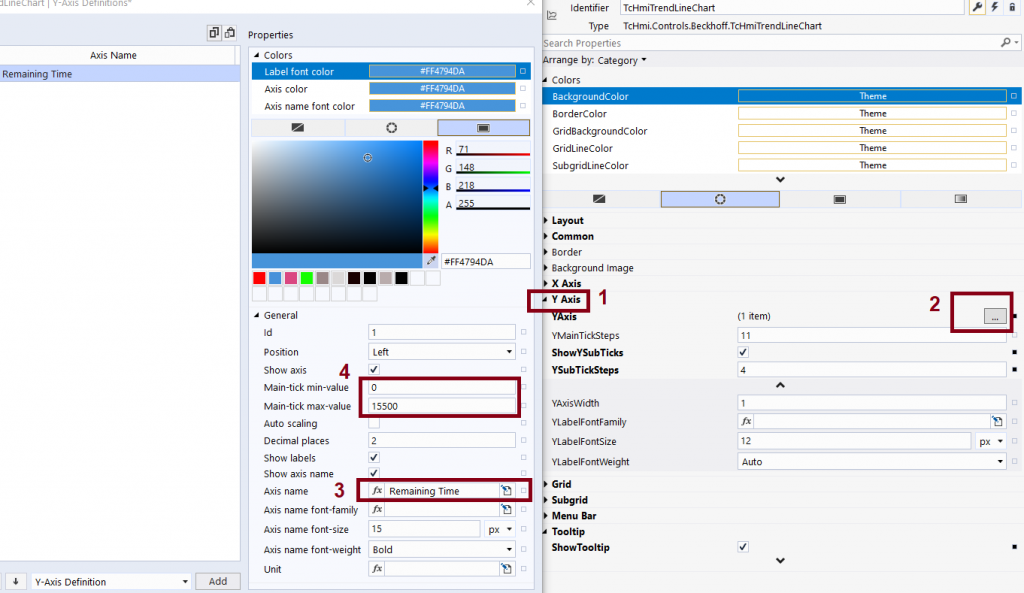
Figure 5: Y axis configurations for line chart
STEP 06:
X-axis configuration, most default settings for the X-axis are fine as shown in the following figure.
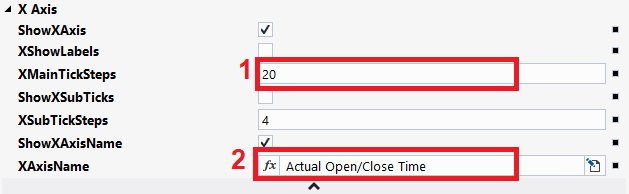
Figure 6: X axis configurations for line chart
STEP 07:
The actual symbol configurations. We can select the symbol, interval, etc by these steps as shown in the following figure.
We can tell the extension when to collect the data (it can be first or some specific time). PT2M means to use the latest 2 minutes of data. We are selecting the historized symbol in step 4. Also, we can select the Y axis (previously created). There are some common settings that we can use as shown in steps 6 and 7.
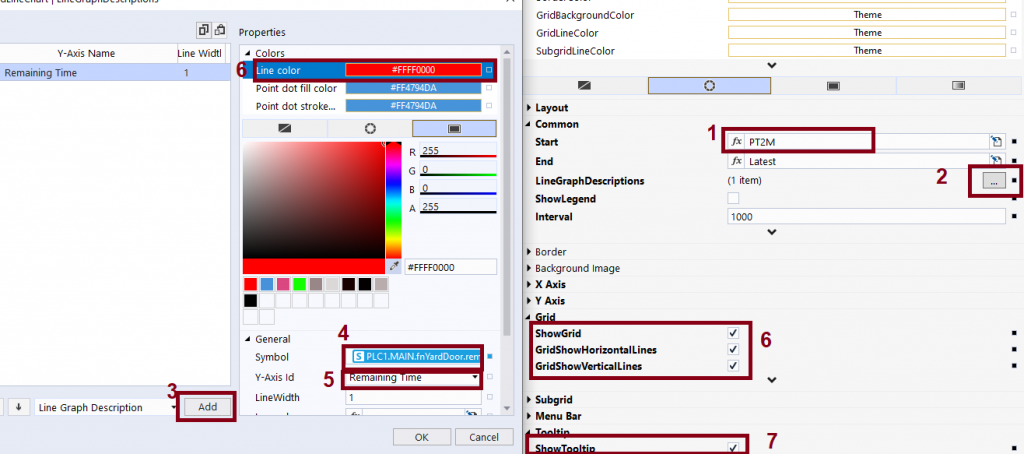
Figure 7: Configuration of the historized symbol
Now if we see our live view, we should be able to see the application. We can toggle the obstacle and see how it affects the opening and closing time. We can stop the logging and examine the individual value of our symbol.
See also
https://www.hemelix.com/scada-hmi/twincat-hmi/animation-in-twincat-hmi/ (For HMI and Animation program)
https://www.hemelix.com/automation/state-machine-in-structured-text/ (For PLC program)
References
Tips
TIPS 01: List containing all historized symbols:
TcHmi.Server.readSymbol(‘TcHmiSqliteHistorize.Config::historizedSymbolList’, data => {
if (data.error !== TcHmi.Errors.NONE ||
data.response.error ||
data.response.commands[0].error) {
// Handle error(s)
return;
}
// Handle result…
console.info(
‘TcHmiSqliteHistorize.Config::historizedSymbolList=’ +
data.response.commands[0].readValue);
});
Download the sample from the link given above.
See next our HMI Scope example at https://www.hemelix.com/scada-hmi/twincat-hmi/twincat-hmi-scope/
Ask questions related to Hemelix sample code and design at Google group https://groups.google.com/g/hemelix