Display Google Maps on TwinCAT HMI
Often, with JavaScript, we want to manipulate HTML elements. The HTML DOM allows JavaScript to change the style of HTML elements as well.
The HTML Host offers the possibility to use pure HTML content on the user interface. This control can be filled with content and modified in the HTML editor of the designer. We can create independent page and that page can be loaded or activated by the TwinCAT HMI Engineering framework.
Latitude and Longitude
The most common system for locating points on the earth is with “Longitudes” and “Latitudes”. Both longitude and latitude are angles measured with the center of the earth as an origin. Longitude is an angle from the prime meridian, measured to the east (longitudes to the west are negative).
Latitudes measure an angle up from the equator (latitudes to the south are negative). They are called LAT/LNG in short. Latitude can be +90 (towards the north pole) to -90 (towards the south pole) degrees. Longitude can be +180 (towards east) to -180 (towards west) degrees.
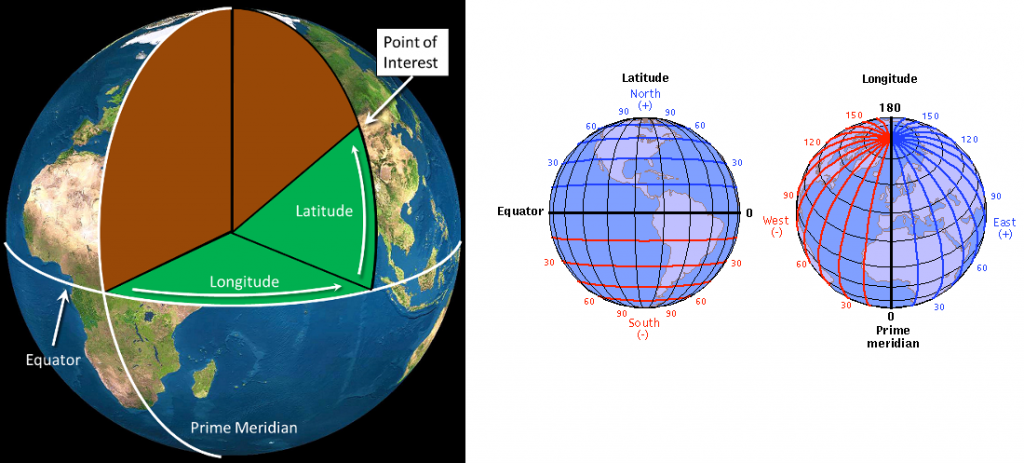
Figure 01: Latitude and longitude (source)
Example coordinates:
Kars – Osgoode, Ottawa, ON, Canada
45°13'35.8"N 75°35'24.6"W
45.226606, -75.590168
Karoo Hoogland Municipality, South Africa
31°38'36.4"S 21°19'53.9"E
-31.643456, 21.331650
Sea of Japan (also known as the East Sea)
39°46'08.3"N 134°31'47.4"E
39.768971, 134.529834
Cieneguilla, Peru
12°02'39.5"S 76°47'26.0"W
-12.044302, -76.790541
Display Basic map, Step by Step
=> Insert an HTML host to the desktop view
=> Create a Google map property object with the following attributes
Center, latitude, and longitude of value for the google map
zoom, what would be the zoom value when the map is displayed, we use 10 as a global variable
=>Create the map to the global variable myGlobalMap, we use global variable so that the zoom level can be set anytime.
=> We use the google maps API, key (we are not using so it shows for development purpose only) and pass the map initialization function (initMap) as call back
=> We are listening the zoom_changed event if we want to do something, here we are not using it.
<div id="TcHmiHtmlHost" data-tchmi-type="TcHmi.Controls.System.TcHmiHtmlHost" data-tchmi-height="700" data-tchmi-height-unit="px" data-tchmi-left="232" data-tchmi-left-unit="px" data-tchmi-top="10" data-tchmi-top-unit="px" data-tchmi-width="558" data-tchmi-width-unit="px" data-tchmi-is-enabled="true">
    <div id="map" style="width:100%;height:750px;"></div>
    <script>
        function initMap() {
            var mapProp = {
                center: new google.maps.LatLng(51.88235831881877, 8.508717738253882),
                zoom: g_zoomLevel,
                minZoom: 1,
                fullscreenControl: false,
                zoomControl: false,
                mapTypeId: google.maps.MapTypeId.ROADMAP
            };
             myGlobalMap = new google.maps.Map(document.getElementById("map"), mapProp);

            google.maps.event.addListener(myGlobalMap, 'zoom_changed', function () {
                var zoomLevel = myGlobalMap.getZoom();
                console.log(zoomLevel);
                //map.setZoom(12); // have a fixed map
            });
        }
    </script>
<script src="https://maps.googleapis.com/maps/api/js?key=&callback=initMap"></script>

</div> 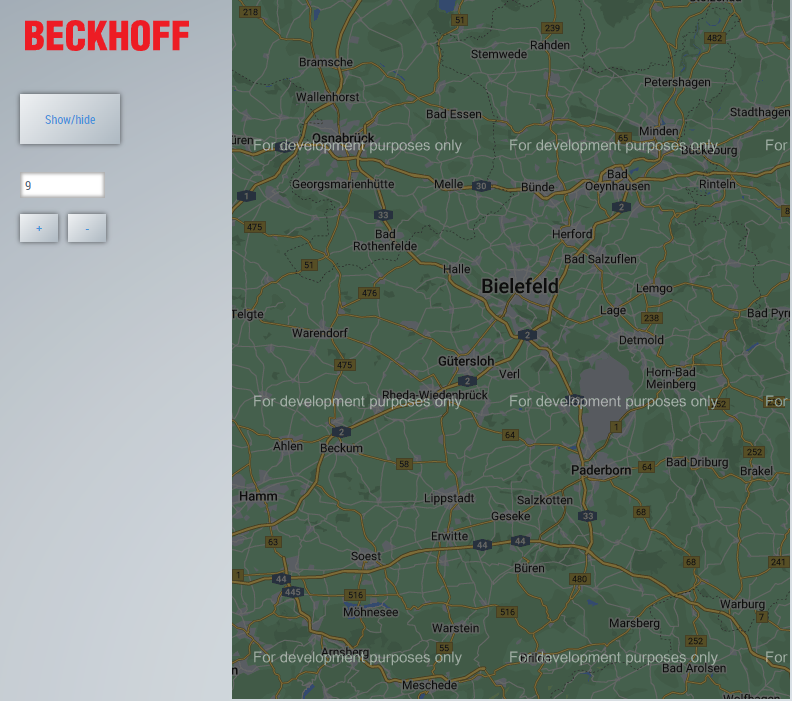
Figure 02: Sample google map HMI, displaying zoom level and button for zoom out and zoom in
Google Map Control
Map control parameters:
{
  zoomControl: boolean,
  mapTypeControl: boolean,
  scaleControl: boolean,
  streetViewControl: boolean,
  rotateControl: boolean,
  fullscreenControl: boolean
}
Google Map Events
Following are the possible events that we can get notified and do something based on the evets.
bounds_changed
center_changed
click
contextmenu
dblclick
drag
dragend
dragstart
heading_changed
idle
maptypeid_changed
mousemove
mouseout
mouseover
projection_changed
resize
rightclick
tilesloaded
tilt_changed
zoom_changed
Get the Event
Mouse Event:
The event listener should be implemented inside the initMap (the initialized function).
<script>
        function initMap() {
            //get notified when zoom level changed
            google.maps.event.addListener(myGlobalMap, 'zoom_changed', function () {
                var zoomLevel = myGlobalMap.getZoom();
                console.log(`zoom_changed value = ${zoomLevel}`);
               //Do something specific to zoom level changed
            });
            //get notified when a clock is made on the map
            google.maps.event.addListener(myGlobalMap, 'click', function (e) {
                var locs = { lat: e.latLng.lat(), lng: e.latLng.lng() };
                console.log(e.latLng.lat()); //latitude
                console.log(e.latLng.lng()); //longitude
            });
        } //initMap
 </script>
Drag/Mouse event :
function initMap() {
	myGlobalMap.addListener("click", (e) => {
		console.log('A mouse click');
		console.log(e.latLng.lat()); //latitude
		console.log(e.latLng.lng()); //longitude
	});
	myGlobalMap.addListener("drag", (e) => {
		console.log('A drag');
	});
}
Lorem ipsum dolor sit amet, consectetur adipiscing elit. Ut elit tellus, luctus nec ullamcorper mattis, pulvinar dapibus leo.
Draw a rectangle on Google Map
<div id="TcHmiHtmlHost" data-tchmi-type="TcHmi.Controls.System.TcHmiHtmlHost" data-tchmi-height="1700" data-tchmi-height-unit="px" data-tchmi-left="232" data-tchmi-left-unit="px" data-tchmi-top="10" data-tchmi-top-unit="px" data-tchmi-width="1558" data-tchmi-width-unit="px" data-tchmi-is-enabled="true">
    <div id="map" style="width:100%;height:1700px;"></div>
    <script>
        function initMap() {
             var _map = new google.maps.Map(document.getElementById("map"), {
                zoom: 11,
                center: { lat: 33.678, lng: -116.242 },
                mapTypeId: "terrain",
            });
             const rectangle = new google.maps.Rectangle({
                strokeColor: "#FF0000",
                strokeOpacity: 0.8,
                strokeWeight: 5,
                fillColor: "#FF0000",
                fillOpacity: 0.5,
                _map,
                bounds: {
                    north: 33.685,
                    south: 33.671,
                    east: -116.234,
                    west: -116.251,
                },
             });
            rectangle.setMap(_map);
        }
            </script>
            <script src="https://maps.googleapis.com/maps/api/js?key=&callback=initMap"></script>
</div>
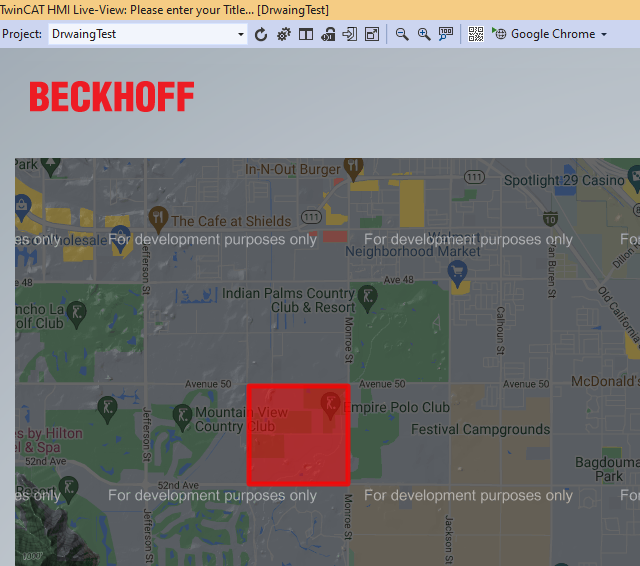
Figure 03: Sample google map HMI, drawing rectangle on HMI
bounds: {
        north: 41.001, // Latitude coordinate of Colorado's North
        south: 36.971, // Latitude coordinate of Colorado's South
        east: -102.047, // Longitude coordinate of Colorado's East
        west: -109.078, // Longitude coordinate of Colorado's West
    },
Get the zoom change event
The event listener should be implemented inside the initMap (the initialized function).
    <script>
        function initMap() {
            var mapProp = {
                center: new google.maps.LatLng(63.31235831881877, 25.858717738253882),
                zoom: g_zoomLevel,
                minZoom: 1,
                fullscreenControl: false,
                zoomControl: false,
                mapTypeId: google.maps.MapTypeId.ROADMAP
            };
             myGlobalMap = new google.maps.Map(document.getElementById("map"), mapProp);
            google.maps.event.addListener(myGlobalap, 'zoom_changed', function () {
                var zoomLevel = myGlobalMap.getZoom();
                console.log(`zoom_changed value = ${zoomLevel}`);
            });
           </script>
Insert delay initializing Google map
We need to initialization of the map after certain time, in this section we shall show how to do that.
We can tell the Google map to call initMap method from our script as shown in the following code.
<script> src="https://maps.googleapis.com/maps/api/js?key=&callback=initMap"</script>
We can tell the Google map to call initMap method from our script after certain time as shown in the following code.
   <script>
      setTimeout(() => {
          console.log("Delayed for 1 second.");
          initMap();
      }, 1000)
   </script>
<div id="TcHmiHtmlHost" data-tchmi-type="TcHmi.Controls.System.TcHmiHtmlHost" data-tchmi-height="919" data-tchmi-height-unit="px" data-tchmi-left="176" data-tchmi-left-unit="px" data-tchmi-top="25" data-tchmi-top-unit="px" data-tchmi-width="1708" data-tchmi-width-unit="px" data-tchmi-is-enabled="true" data-tchmi-zindex="0">
   <script src="https://maps.googleapis.com/maps/api/js?key=&libraries=geometry" async defer></script>
   <div id="map" style="width:100%;height:100%" data-tchmi-zindex="1"></div>
   <script>
      setTimeout(() => {
          initMap();
      }, 1000)
      function initMap() {
          var mapProp = {
              center: new google.maps.LatLng(51.88235831881877, 8.508717738253882),
              zoom: g_zoomLevel,
              minZoom: 1,
              fullscreenControl: false,
              mapTypeId: google.maps.MapTypeId.ROADMAP
          };
          myGlobalMmap = new google.maps.Map(document.getElementById("map"), mapProp);
          google.maps.event.addListener(myGlobalMmap, 'zoom_changed', function () {
              var zoomLevel = myGlobalMap.getZoom();
              console.log(zoomLevel);
          });
      }
   </script>
</div>
Drawing on Google Map
Polyline drawing on top of Google map:
These should be within the initMap function.
const flightPlanCoordinates = [
	{ lat: 61.319348, lng: 23.859161 },
	{ lat: 61.320963, lng: 23.857401 },
	{ lat: 61.320632, lng: 23.856610 },
	{ lat: 61.319442, lng: 23.854094 },
	{ lat: 61.319920, lng: 23.852985 }
	];
const flightPath = new google.maps.Polyline({
path: flightPlanCoordinates,
geodesic: true,
strokeColor: "#FF00FF",
strokeOpacity: 1,
strokeWeight: 6,
});
flightPath.setMap(_map);
Polyline info
When we have an object on Google Map, we can information by mouseclick or mouseover event:
These should be within the initMap function.
var polyArray = [];
var globalPolyObjects = {};
var ginfoWindow = undefined;
globalPolyObjects['polyLine1'] = {
    "coordinates": [
        { lat: 51.88084178499442, lng: 8.506662854998747 },
        { lat: 51.88285178499442, lng: 8.607663854998747 }
    ],
    strokeColor: 'red',
    name: "polyLine1"
};
globalPolyObjects['polyLine_2'] = {
    "coordinates": [
        { lat: 51.88486178499442, lng: 8.708664854998747 },
        { lat: 51.88687178499442, lng: 8.809665854998747 }
    ],
    strokeColor: 'blue',
    name: "polyLine_2"
};
Inside initMap method we insert the following code:
for (var singlePath in globalPolyObjects) {
    var populationOptions = {
    path: globalPolyObjects[singlePath].coordinates,
    geodesic: true,
    strokeColor: globalPolyObjects[singlePath].strokeColor,
    strokeOpacity: .8,
    strokeWeight: 5,
    name: globalPolyObjects[singlePath].name
    };
 var myownpath = new google.maps.Polyline(populationOptions);
 myownpath.setMap(mymap)
 polyArray.push(myownpath);
 google.maps.event.addListener(myownpath, 'mouseover', function (e) {
 var locs = { lat: e.latLng.lat(), lng: e.latLng.lng() };
 var myPosition1 = new google.maps.LatLng(e.latLng.lat(), e.latLng.lng());
 for (var i = 0; i < polyArray.length; i++) {
 if (google.maps.geometry.poly.isLocationOnEdge(myPosition1, polyArray[i], 0.00001)) {
    g_infoWindow = new google.maps.InfoWindow({
    content: polyArray[i].name,
 });
    g_infoWindow.setPosition(locs);
    g_infoWindow.open(mymap);
    break;
    }
   }
 });
 google.maps.event.addListener(myownpath, 'mouseout', function (e) {
 if (g_infoWindow != undefined) {
    g_infoWindow.close();
    }
    });
}
Drawing circle and get click event for loading a TwinCAT View
<script>
   var citymap = {};
   citymap['chicago'] = { center: { lat: 41.87763110229289, lng:- 87.6427069217152 }, population: 2714856, name: "Chicago, IL" }; citymap['newyork'] = { center: { lat: 40.73267884401277, lng:- 74.061252853565 }, population: 8405837, name: "New York, NY" }; citymap['losangeles'] = { center: { lat: 34.127999890119156, lng:- 118.19386813666824 }, population: 3857799, name: "Los Angeles, CA" }; citymap['vancouver'] = { center: { lat: 49.280446086883536, lng: - 123.12230900028169 }, population: 603502, name: "Vancouver, BC" };
        var circles;
        function initMap() {
            var mapProp = {
                center: { lat: 42.26178913279782, lng: - 101.20327702924571 },
                zoom: 16,
                minZoom: 1,
                fullscreenControl: false,
                zoomControl: false,
                mapTypeId: google.maps.MapTypeId.ROADMAP
            };
            var map = new google.maps.Map(document.getElementById("mapdiv"), mapProp);
            circles = new Array();
            for (var city in citymap) {
                var populationOptions = {
                    strokeColor: '#FF0000',
                    strokeOpacity: 0.8,
                    strokeWeight: 2,
                    fillColor: '#FF0000',
                    fillOpacity: 0.35,
                    map: map,
                    center: citymap[city].center,
                    radius: Math.sqrt(.02) * 100
                };
                // Add the circle for this city to the map.
                var circle = new google.maps.Circle(populationOptions);
                circle.setMap(map);
                circles.push(circle);
                google.maps.event.addListener(circle, 'click', function (e) {
                    var locs = { lat: e.latLng.lat(), lng: e.latLng.lng() };
                    for (var ii = 0; ii < circles.length; ii++) {
                        var b = circles[ii].contains(new google.maps.LatLng(e.latLng.lat(), e.latLng.lng()));
                        if (b == true) {
                            console.log(Object.values(citymap)[ii].name);  // Find where user has click
   //Load a view for example that is native to TwinCAT
   var v1 = TcHmi.View.get(); console.log('Button pressed ' + v1.getId());
   TcHmi.View.load('View1.view', function (data) { var v2 = TcHmi.View.get(); console.log(v2.getId()); });
                            /*
                            var jj = 0;
                            for (const [key, value] of Object.entries(citymap)) {
                                if (ii == jj) {
                                    console.log(`The circle name = ${value.name}`);
                                    break;
                                }
                                jj++;
                            }
                            */
                            break;
                        }
                    }
                });
            }
            google.maps.Circle.prototype.contains = function (latLng) {
                return this.getBounds().contains(latLng) && google.maps.geometry.spherical.computeDistanceBetween(this.getCenter(), latLng) <= this.getRadius();
            }
        }
</script>
Drawing curve on Google Map
We need to load different library for drawing and doing calculation with Google Map. Load the drawing library with the following script.
<script src="https://maps.googleapis.com/maps/api/js?key=&callback=initMap&libraries=drawing"> </script>
            setTimeout(() => {
                initMap();
            }, 1000)
            function drawCurve(P1, P2, map) {
                var lineLength = google.maps.geometry.spherical.computeDistanceBetween(P1, P2);
                var lineHeading = google.maps.geometry.spherical.computeHeading(P1, P2);
                if (lineHeading < 0) {
                    var lineHeading1 = lineHeading + 45;
                    var lineHeading2 = lineHeading + 135;
                } else {
                    var lineHeading1 = lineHeading + -45;
                    var lineHeading2 = lineHeading + -135;
                }
                var pA = google.maps.geometry.spherical.computeOffset(P1, lineLength / 2.2, lineHeading1);
                var pB = google.maps.geometry.spherical.computeOffset(P2, lineLength / 2.2, lineHeading2);
                var curvedLine = new GmapsCubicBezier(P1, pA, pB, P2, 0.01, map);
            }
            var rcbc = { lat: 25.774, lng: -60.19 };
            var trafalgar = { lat: 18.466, lng: -46.118 };
            function initMap() {
                var mapProp = {
                    center: {lat: 11.849899088322433, lng:- 61.838434254386996},
                    zoom: 2,
                    minZoom: 1,
                    fullscreenControl: false,
                    zoomControl: false,
                    mapTypeId: google.maps.MapTypeId.ROADMAP
                };
                var map = new google.maps.Map(document.getElementById("mapdiv"), mapProp);
                drawCurve(trafalgar, rcbc, map);
            }
            var GmapsCubicBezier = function (latlong1, latlong2, latlong3, latlong4, resolution, map) {
                var lat1 = latlong1.lat;
                var long1 = latlong1.lng;
                var lat2 = latlong2.lat();
                var long2 = latlong2.lng();
                var lat3 = latlong3.lat();
                var long3 = latlong3.lng();
                var lat4 = latlong4.lat;
                var long4 = latlong4.lng;
                var points = [];
                for (it = 0; it <= 1; it += resolution) {
                    points.push(this.getBezier({
                        x: lat1,
                        y: long1
                    }, {
                        x: lat2,
                        y: long2
                    }, {
                        x: lat3,
                        y: long3
                    }, {
                        x: lat4,
                        y: long4
                    }, it));
                }
                var path = [];
                for (var i = 0; i < points.length - 1; i++) {
                    path.push(new google.maps.LatLng(points[i].x, points[i].y));
                    path.push(new google.maps.LatLng(points[i + 1].x, points[i + 1].y, false));
                }
                var Line = new google.maps.Polyline({
                    path: path,
                    geodesic: true,
                    strokeColor: "#FF00FF",
                    strokeOpacity: 0.8,
                    strokeWeight: 6
                });
                Line.setMap(map);
                return Line;
            };
            GmapsCubicBezier.prototype = {
                B1: function (t) {
                    return t * t * t;
                },
                B2: function (t) {
                    return 3 * t * t * (1 - t);
                },
                B3: function (t) {
                    return 3 * t * (1 - t) * (1 - t);
                },
                B4: function (t) {
                    return (1 - t) * (1 - t) * (1 - t);
                },
                getBezier: function (C1, C2, C3, C4, percent) {
                    var pos = {};
                    pos.x = C1.x * this.B1(percent) + C2.x * this.B2(percent) + C3.x * this.B3(percent) + C4.x * this.B4(percent);
                    pos.y = C1.y * this.B1(percent) + C2.y * this.B2(percent) + C3.y * this.B3(percent) + C4.y * this.B4(percent);
                    return pos;
                }
            };
Draw Polyline by clicking on the map
        <script>
            setTimeout(() => {
                initMap();
            }, 1000)
            let poly;
            let map;
            function initMap() {
                var mapProp = {
                    center: { lat: 41.879, lng: -87.624 },
                    zoom: 7,
                    minZoom: 1,
                    fullscreenControl: false,
                    zoomControl: false,
                    mapTypeId: google.maps.MapTypeId.ROADMAP
                };
                map = new google.maps.Map(document.getElementById("mapdiv"), mapProp);
                poly = new google.maps.Polyline({
                    strokeColor: "#00FF00",
                    strokeOpacity: 1.0,
                    strokeWeight: 3,
                });
                poly.setMap(map);
                // Add a listener for the click event
                map.addListener("click", addLatLng);
            }
            function addLatLng(event) {
                const path = poly.getPath();
                // Because path is an MVCArray, we can simply append a new coordinate
                // and it will automatically appear.
                path.push(event.latLng);
                // Add a new marker at the new plotted point on the polyline.
                new google.maps.Marker({
                    position: event.latLng,
                    title: "#" + path.getLength(),
                    map: map,
                });
            }
        </script>
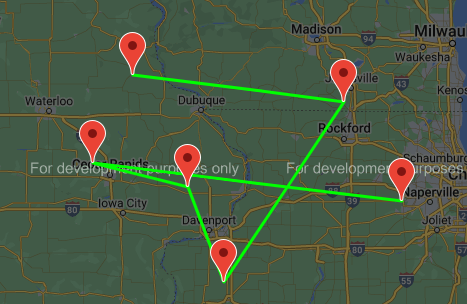
Figure 4: polyline by clicking on the google map
Change circle color after creating it
for (var city in citymap) {
	var populationOptions = {
		strokeColor: '#FF0000',
		strokeOpacity: 0.8,
		strokeWeight: 2,
		fillColor: '#FF0000',
		fillOpacity: 0.35,
		map: map,
		center: citymap[city].center,
		radius: Math.sqrt(.02) * 100,
		info: 'name: ' + citymap[city].name
	};
	// Add the circle for this city to the map.
	var circle = new google.maps.Circle(populationOptions);
	circleArray.push(circle);
	google.maps.event.addListener(circle, 'mouseover', function() {
		console.log('Mouse over !');
	});
	google.maps.event.addListener(circle, 'click', function(e) {
		var locs = {
			lat: e.latLng.lat(),
			lng: e.latLng.lng()
		};
		for (var i = 0; i < circleArray.length; i++) {
			if (circleArray[i].get('fillColor') == "#FF0000") {
				circleArray[i].setOptions({
					fillColor: '#00FF00'
				});
				circleArray[i].setOptions({
					strokeColor: '#FF0000'
				});
			} else {
				circleArray[i].setOptions({
					fillColor: "#FF00FF"
				});
				circleArray[i].setOptions({
					strokeColor: '#FFFF00'
				});
			}
		}
	});
}
Draw text or custom icon on Google Map
	const uluru = { lat: 61.32061257173894, lng: 9.85659538230898 };
      	const contentString = 'some content!';
      	const infowindow = new google.maps.InfoWindow({
        	content: contentString,
         });
       	const marker = new google.maps.Marker({
        	position: uluru,
              	myGlobalMap,
              	icon:   '/Images/Beckhoff_Logo.svg' , //'https://developers.google.com/maps/documentation/javascript/examples/full/images/beachflag.png',
              	label: { color: '#00aaff', fontWeight: 'bold', fontSize: '14px', text: 'Your text here' },
       	});
      	marker.setMap(myGlobalMap);
      	//marker.addListener("click", () => {
       	//    infowindow.open({
      	//        anchor: marker,
      	//        myGlobalMap,
      	//        shouldFocus: false,
      	//    });
      	//});
See an example with jsfiddle http://jsfiddle.net/geocodezip/zf813364/277/
Change the background of map opacity
 <script>
        function initMap() {
            var mapProp = {
                center: new google.maps.LatLng(51.88235831881877, 8.508717738253882),
                zoom: g_zoomLevel,
                minZoom: 1,
                fullscreenControl: false,
                zoomControl: false,
                mapTypeId: google.maps.MapTypeId.ROADMAP
            };
            myGlobalMap = new google.maps.Map(document.getElementById("map"), mapProp);
            document.getElementById("map").style.opacity = .9;  // This part you need change, here we use .9
        }
 </script>
Determining whether the map has been loaded or not
We can declare a global variable that will be false and when the map is loaded completely then the variable is true.
When the map is loaded we can manipulate map related stuff after that.
var  gMapLoadedProperly = false;
function initMap() {
global_map = new google.maps.Map(document.getElementById("mapdiv"), mapProp);
	google.maps.event.addListenerOnce(global_map , 'idle', function () {
	console.log('Map loaded properly');
	gMapLoadedProperly = true;
	TcHmi.Functions.GoogleMapTest.SetDeviceStatus(); //call if needed
});
This affects specially when we do subscription.
Determining whether the window has loaded without using any global variables
    <script>
        function initMap() {
            var mapProp = {
                zoom: 11,
                center: { lat: 33.685, lng: -116.234 },
                mapTypeId: "terrain",
            };
             var _map = new google.maps.Map(document.getElementById("map"), mapProp);
            function checkLoaded() {
                return document.readyState === "complete";
            }
            console.log(checkLoaded());  // print true or false
Tips:
01:
rectangle.setMap(_map); //we must call setMap method, otherwise it will not work
02:
When we provide a bound object then we supply the following coordinate.
east -> longitude (longitude of the point east point)
west -> longitude
north -> latitude
south -> latitude
03:
TcHmi.Controls.System.TcHmiHtmlHost should have valid height and width. If the value is zero then the map will not be visible, we scratch our heads to find the reason!
04:
If the region overlapped with the map, the map will not work, one solution could be changing the z-index.
05:
We can call or make sure that the initMap will call later (not sure really does it help or need to wait until load completely)
        <script src="https://maps.googleapis.com/maps/api/js?v=3&sensor=false&libraries=geometry" async defer></script>
        <div id="mapdiv" style="width: 100%; height: 100%;" data-tchmi-zindex="2"></div>
        <script>
            setTimeout(() => {
                console.log("Delayed for 1 second.");
                initMap();
            }, 1000)
	...
	</script>
06: Getting coordinate from clicking on the Map.
 map.addListener("click", (mapsMouseEvent) => {
    // Close the current InfoWindow.
    infoWindow.close();
    var v = mapsMouseEvent.latLng.toJSON();
    var locs = {lat: v.lat, lng: v.lng };
    console.log(locs);
    console.log(mapsMouseEvent.latLng.toJSON());
    // Create a new InfoWindow.
    infoWindow = new google.maps.InfoWindow({
    ...
07: Having offset when pressing on the polygon
If we don’t have right settings in the HMI project then we can stretched polygon and as result the polygon will displaced. If we click on the polygon it will show the click point at different location and may not work at all
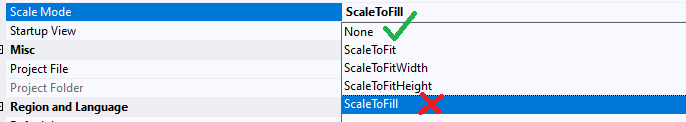
Figure 5: Selection of suitable settings for HMI project when using Google map
08: Uncaught ReferenceError:
google is not defined, google related stuff has not been loaded yet and we are using it that causes this error. In the following code snippet, we see both cases will generate the error. We can move the definition of google related stuff inside initMap method or load the function in question a little base later.
            google.maps.Polygon.prototype.getBounds1 = function (latLng) {
            ...
            };
           function initMap() {
           ...
           //should be here.
           }
            google.maps.Polygon.prototype.getBounds1 = function (latLng) {
                ...
            };
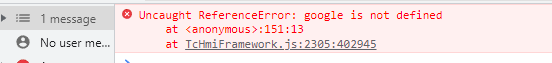
Figure 6: Google related stuff has not been loaded causes this error
09: Object color in Google Map:
Say we have defined two colors like the following way:
var yellowColor = {
    "color": "rgba(255, 255, 0, 1)"
};
var redColor = {
    "color": "rgba(255, 51, 0, 1)"
};
Following code can change the color of myCircle
if (readValue == true) {
myCircle[0].setOptions({ fillColor: "red", strokeColor: "blue" });
}
else {
myCircle[0].setOptions({ fillColor: "green", strokeColor: "black" });
}
Following code cannot change the color of myCircle for some reason (but works for Beckhoff HMI)
if (readValue == true) {
myCircle[0].setOptions({ fillColor: redColor, strokeColor: redColor });
}
else {
myCircle[0].setOptions({ fillColor: yellowColor, strokeColor: yellowColor });
}
References
https://developers.google.com/maps/documentation/javascript/examples/control-custom?hl=en
How to manipulate DIV element (add and remove) https://www.w3schools.com/jsref/met_document_createelement.asp
HTML Event: https://www.w3schools.com/js/js_events.asp
How to insert tree view in an HMI page
https://www.hemelix.com/scada-hmi/twincat-hmi/display-tree-like-nodes-to-twincat/
How to add Map on a page (https://developers.google.com/maps/documentation/javascript/examples/polyline-simple)
We are designing YouTube video for this, so please visit us later!
Download the sample from the link given above.
See next how to use EcDiagnosticsControl at https://www.hemelix.com/scada-hmi/twincat-hmi/hmi_ecdiagnosticscontrol/
Ask questions related to Hemelix sample code and design at Google group https://groups.google.com/g/hemelix